![BOXARR LOGO - PORTRAIT [RED - NAVY] RGB.](https://static.wixstatic.com/media/b3c918_4391a8c176ea42dc86e96ac62632c6aa~mv2_d_1582_1703_s_2.png/v1/fill/w_104,h_109,al_c,q_85,usm_0.66_1.00_0.01,enc_avif,quality_auto/BOXARR%20LOGO%20-%20PORTRAIT%20%5BRED%20-%20NAVY%5D%20RGB_.png)

Supply-Web
& Value-Stream
Resilience
of organisations believe their supply chain resilience is a core strategic investment priority
88%
![BOXARR LOGO - LANDSCAPE [ORANGE -WHITE] RGB.png](https://static.wixstatic.com/media/b3c918_4a8ec8c1d22e4598890b43c6163ddef1~mv2_d_6510_1838_s_2.png/v1/fill/w_356,h_100,al_c,q_85,usm_0.66_1.00_0.01,enc_avif,quality_auto/BOXARR%20LOGO%20-%20LANDSCAPE%20%5BORANGE%20-WHITE%5D%20RGB.png)
is helping organisations around the world to transform the way they manage their complex supply-webs and value streams
Integrate data from your ERP, WMS, and TMS systems into a single source of truth.
Monitor geopolitical, weather, and financial threats to activate backup plans early.
Visually map material and information flows to eliminate non-value-added waste.
Strategically position safety stock at critical bottleneck points to absorb disruptions.
Design optimal facility locations, production capacities, and distribution hubs globally.
Build strategic partnerships with key vendors to drive innovation and priority access.
Evaluate all cost, including logistics, tariffs, and carrying costs, not just purchase price.
Break down internal silos between sales, procurement, operations, and logistics teams.
Align real-time customer demand data directly with manufacturing plans and schedules.
Apply Kaizen and Six Sigma principles to relentlessly optimize flow and quality.
Avoid single points of failure by diversifying suppliers across different geographic regions.
Route orders to alternative pre-qualified suppliers instantly when disruptions hit.
Goodbye Disparate Data Silos
Hello Value-Stream DigitalTwins
BOXARR Models are inherently dynamic DigitalTwins of your systems and organisations. They can consistently evolve through changes in underlying data feeds from your information systems and from the collaborative input from the stakeholders and subject experts across your enterprise:
-
Human Readable without the need to learn complicated modelling languages
-
Multi-contextual visualisations to reveal opportunity and mitigate risk
-
Intuitive usability reduces time/cost of training and optimises your adoption
-
Collaborative engagement by stakeholders across your organisation
-
Analytical by design with computational Functions and conditional formatting
-
Interoperating with your data sources and infosystems via CSV & API
-
Scalable to incorporate enterprise-wise supply & value-stream resilience.


BOXARR Solutions by Design
Boxes | Arrows | Groups | Fields
Boxes
-
Generate Box Types to represent your supply-web network - e.g.: Parts at Supplier; Parts in Warehouse Components; Services; Assemblies; Products; Activities; Kaizen; Contracts; etc.
Arrows
-
Generate Arrow Types to represent their interdependency relationships - e.g.: Supply; Transfer; Value-Stream; Contract; etc.
Groups
-
Generate Group Types to represent contextual lenses - e.g: Value-Streams; Work Centers; Product Categories; Geo-Locations; etc.
Properties
-
Assign relevant data Fields to each Type of Box/Arrow/Group to reflect their attributes and KPIs - e.g.: Numeric, Alpha-numeric, Boolean (Checkbox), HTML, URL, Temporal, Function Results, etc.
Data
-
Leverage data from your enterprise infosystems - e.g.: ERP; WMS; TMS; CRM; etc.
-
Leverage data from your external sources - e.g.: D&B Reports; Risk Reports; FX; Tariffs; Intelligence Feeds; Questionnaires; etc.
Projects that Compute
Functional Analytics

BOXARR incorporates a powerful Functions Framework to enable computation and analyses of data and relationships across the Model.
Functions can compute data values within and between the Objects in a Model, and follow paths of Arrows, or hierarchies of Groups. For example:
-
Roll-ups (aggregations) of costs / time / risks / assets / etc.
-
Counts and summaries of up/downstream dependencies
Functions can also be utilised to conditionally format the Model Objects (e.g. apply RAG status or heatmap based upon a risk metrics).
Functions can be applied on demand to a Model as-a-whole or to individual Model Layers (e.g. to assess a change-scenario)


Model Layers
-
Configure and apply pre-Filters to slice-and-dice your Supply-Webs and Value-Sreams for different use-cases or User Groups - e.g.:
-
"Layer A" = Entire Products & Services Portfolio
-
"Layer B" = Product A Supply and Value-Stream
-
"Layer C" = Product B Supply and Value Stream (Subset X)
-
-
Define which data attributes are available in the Properties Pane
-
Utilise Layers for Collaborative Editing (can merge changes)
-
Utilise Layers for performing 'What-if' change-impact Scenarios
Model Layer Views
-
Generate pre-configured default Views for:
-
Dependency Networks / Data Tables / Gantt Schedules
-
-
Configure and apply additional pre-Filters per View
-
Define which Label Sets are available to Users
-
Define which Colour Sets are available to Users
User Roles
-
Define which Users/User Groups can utilise each Layer
-
Define User permissions - e.g.:
-
Access / Edit / Merge / Import / Export / etc.
-
Engage with your Value-Streams as
Dynamic Dependency Networks
With BOXARR, your holistic supply-webs and value-streams can be visualised and navigated as dynamic task dependency networks:
-
Switch the Model between Contextual Groupings - e.g.:
-
Work Breakdown (Supply and Value-Streams)
-
Work Centers (External Suppliers / Internal Facilities)
-
Operational Locations
-
Product Categories
-
-
Expand/Collapse the Network Depth for more/less fidelity
-
Zoom and pan the Network to focus on areas of concern
-
Show/hide configurable data Labels on Boxes/Arrows/Groups
-
Show/hide empty Groups (Groups which contain no activities)
-
Show/hide Colour Options (conditional formatting of Objects)
-
Apply variable 'weights' to Arrows based on selected metrics
-
Summarise Arrows with aggregated Data Labels
-
Apply data summaries to Groups (aggregated Box Data)


Engage with your Value-Streams as
Dynamic Data Tables
With BOXARR, your Supply-Web and Value-Stream information can also be visualised as dynamic Data Tables of KPIs:
-
Generate Data Tables of data for Boxes / Arrows / Groups
-
Assign, order, and sort columns by Data Fields & Functions
-
Incorporate Colour Functions for visual indicator metrics - e.g.
-
RAG
-
Risk
-
-
Define formatting styles for numeric, date, time, values
-
Export data to spreadsheets (User permissions required)
Forecast & Backcast your Value-Streams as
Dynamic Gantt Schedules
BOXARR’s integrated scheduler generates Gantt Schedule visualisations of the Model using data attributes assigned to Boxes (e.g. Duration) and Arrows (e.g. Precedence).
-
Generate "Date" Schedules (i.e. actual calendar dates)
-
Generate "Relative" Schedules (i.e. Week-1 / Week-2 / etc.)
-
Switch the Schedule between Contextual Groupings
-
Zoom in/out of the Schedule to adjust the temporal scale
-
Expand/Collapse the Schedule Depth for more/less fidelity
-
Select Objects to reveal Earliest Start and Latest End
-
Select Objects to view their attributes in the Properties Pane
-
Show/hide Scheduling violations
Forecast: by scheduling from a specific Start date
-
Understand when your Objectives can be realised.
Backcast: by reverse scheduling from a specific Target date
-
Understand when investments, change, and effort need to be made.

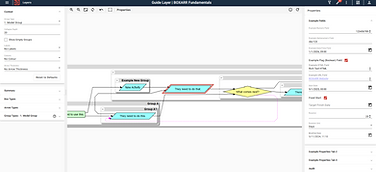

Review and Edit Project Data
Properties Pane
The Properties Pane displays selected data attributes of any Box or Arrow or Group selected by the User. The Properties Pane can be individually configured for each Model Layer for relevance, and for sensitive data protection (e.g. where some data Fields/Functions may not be relevant to ,or may be withheld from, certain User Groups).
-
Display Field values and Function values by Object Type
-
Field/Functions can be sorted into collapsible Tabs for easy navigation
-
Field values can be edited when the Model is in "Edit Mode"
This approach ensures your Model Views remain clear and uncluttered for effective visual analysis - while enabling detailed information to be easily accessed by Users on demand.
The Properties Pane can be hidden by the User when not required.
Navigate and Focus by
Parametric Filters
In addition to the preset Filters applied to your Model Layers, Users can configure and apply their own parametric User Filters. For example:
-
Filter to specific a Products value-stream (supply through production)
-
Filter to a specific Product Category
-
Filter to specific Production Phase
-
Filter to specific types of Activities
-
Filter to specific Work Centres
-
Filter to specific Locations
-
Filter to specific paths of Operational Tasks
-
etc.
User Filters can be reconfigured on-the-fly, to follow and focus on areas and aspects of concern.


Surface KPIs
Dynamic Labelling
Users can switch between "Label Sets" to surface different collections of KPI reporting data (Field/Function values) onto the Objects in the Model - enabling rapid visual analysis:
Labels on Boxes
-
Display configurable Sets of KPI data on Boxes
Labels on Arrows
-
Display configurable sets of KPI data on Arrows (6 positions per Arrow)
-
Arrows can be 'Summarised' when Groups are collapsed
-
Summarised Arrows display aggregated values (min/max/sum/count/etc.)
-
Summarised Arrows can be "Split" by up/downstream Group Type
-
Arrows can also we "Weighted" by a selected Field or Function value.
Labels on Groups
-
Display configurable Sets of KPI data on Groups
-
Group Data:
-
Display Group data which auto-aggregates according to Group Depth
-
-
Box Data:
-
Display mini-pivot tables of Box Data for Boxes within the Group
-
Auto-aggregates according to Group Depth
-
Pivots can be "Split" by Group Type
-
Visual Analytics
Dynamic Colour Analytics
Users can switch between "Colour Sets" to apply different Colour-by Functional Analyses onto the Objects in the Model - enabling rapid visual analysis:
Colouring Boxes
-
Colour Boxes by their Box Type (default); or
-
Colour by a Function (e.g. Aggregated Risk, etc.)
Colouring Arrows
-
Colour Arrows by their Arrow Type (default); or
-
Colour by a Function (e.g. inherited slippage, etc.)
Colouring Groups
-
Colour Groups by their Group Type (default); or
-
Colour by a Function (e.g. Supplier Risk Heatmap, etc.)
Colouring Labels
-
Colour Functions can also be assigned as Labels on Model Objects: Boxes/Arrows/Groups
-
Enable rapid visual RAG/Heatmap indicators


Mitigate Risk with
Collaborative Planning
BOXARR is an inherently collaborative platform. This means that Supply Managers and Production Managers can collaborate both within and between individual Product threads and across the Product/Service Portfolio as a whole to manage the complex webs of interdependencies.
In addition, other Stakeholders and Subject Matter Experts (SMEs) across your organisation can be engaged with Role-based Permissions to collaborate on planning and problem solving.
-
Access authorised Model Layers with Role-based permissions
-
Navigate and analyse projects and portfolios via multi-contextual Views
-
Collaboratively edit projects, tasks and data attributes
-
Leverage data imports from your external infosystems and data sources to populate and update
-
Merge your changes to the Master to update the "as-is" status
-
Export selected data to inform your other infosystems
Assure resilience with
Change Impact Scenarios
With BOXARR, you can create "Layers" over your Master Model to perform "What-if" change-scenarios. Then visualise/analyse the propagating impacts of changes. This enables evidence-based decision support and collaborative de-risking the delivery of your Objectives and builds resilience across your modelled system of systems.
Proactive Value
-
Proactively "model & evaluate" potential changes to your Suppliers or Production (additions, delays, variations, critical events, etc.).
-
Collaboratively visualise and assess the propagating effects
-
Quickly and effectively update your Master Model when required
Reactive Value
When the unforeseen inevitably happens:
-
Respond to critical change quickly and effectively
-
Collaboratively visualise and assess the propagating effects
-
Collaboratively war-game and plan remedial action
-
Merge your remedial action into your Master Model


Assure Stakeholder reporting with
Dynamic Dashboards
BOXARR nSight enables the enormous analytical value generated from your Supply-Webs and Value-Streams to be presented to stakeholders as interactive and interrogatable Dashboards.
-
Dashboards can be assigned to take data from specific Model Layers
-
Generate Dashboards for holistic Products and Services Portfolios
-
Generate Dashboards for specific Product value-stream and supply
-
Visualise Value Streams as:
-
interactive Gantt Schedules
-
interactive Dependency Networks
-
interactive Data Tables
-
-
Surface KPI metrics in interactive dynamic charts and graphs
-
Share Dashboards with relevant Stakeholders
Orchestrate with other infosystems
BOXARR Data I/O and API
Most organisations struggle to manage multiple 'siloed' information systems, tools, and data repositories...
BOXARR can be effectively utilised as the "Aggregating Overlay" - enabling you to collate, aggregate, visualise, and analyse the holistic data across the system of systems: identifying hidden risks of interdependency and revealing hidden opportunities for opimisation.
BOXARR supports data-exchange (Input/Output) with 3rd-prty systems via both CSV import/export and configurable BOXAR JSON API:
-
Import Project data from 3rd-party planning/infosystems
-
Export data to 3rd-party planning/infosystems
-
Round-trip data with unique Internal and External Ids


Reflect Your Reality With
'Real World' Scalability
A significant problem with legacy modelling tools is their inability to scale to the actual size of challenges you're are facing. Even a small organisation can't be realistically reflected in a Slide, or a Diagram, or a Systems Drawing - let alone reflecting a multinational enterprise.
BOXARR enables you to build and evolve Models which reflect the 'real world' scale of your organisations; with the breadth, depth, and fidelity to truly understand and manage your complexity:
-
Operate Models which can scale from simple systems to highly complex networks incorporating hundreds of thousands of Boxes and millions of data attributes.
-
Leverage Model Layers and Parametric Filtering to navigate your complexity and visualise/analyse areas and aspects of concern.


